
Pivot Table is an essential data analysis tool to answer many important business questions. It allows you to summarize a large amount of data in the least possible time. While creating a single pivot table on the spreadsheet isn’t rocket science, adding multiple tables might be challenging, especially for those who have recently dipped their toes in the Excel world.
But there’s no need to stress over it, as we’ve covered you. This comprehensive tutorial is intended to educate you on everything about the Pivot Table, how it works, and how you can make multiple pivot tables on one sheet. So, shall we proceed?
Pivot Table – A Quick Introduction
A Pivot table is one of the Excel’s most effective and intimidating functions. It can help you understand complex and massive data sets while making sense out of them. This function is particulary advantageous if you have an extensive number of rows or columns stocking values you want to track their sum or simply wish to compare them each other.
Simply put, pivot tables extract meaning from that seemingly endless jumble of numbers on your screen. But do you know why these tables are called “Pivot” tables? Well, the word stems from the fact that you can rotate the data in the table to view it from multiple perspectives.
Also, this table helps you group your data in multiple ways, so you can easily draw helpful conclusions.
What’s the use of Pivot Table?
If you still wondering why you should opt for Pivot tables instead to their simple alternatives, this subhead should interest you. The major objective of this MS Excel function is to offer user-friendly ways to summarize large amounts of data, so you can easily analyze and understand the numerial data in detail.
Here’s a quick rundown of some scenerios where pivot tables could be of great value. Check them out and decide accordingly.
- Combining Duplicate Data
The repeated appearance of the same data can lead to confusion. That’s where a Pivot table comes into the role. The best use of a Pivot table is to combine duplicate data into one, so you easily analyze the details without doing miscalculations. Moreover, it also avoids data overlapping.
- Simplicity
Another important advantage of using the Pivot table is its overall simplicity. You can easily summarize data with this MS excel function. Drag the columns to different sections of the table and re-arrange them with a swipe of your fingertips.
- Helps in decision making
Since the pivot table arranges large chunks of data appropriately, it simply helps users in decision-making without sacrificing the precision of quantitative certainty.
- Quick Reports
The next best advantage of using the Pivot table is that it delivers quick reports, thus enabling users to make quick decisions without causing further delay. Reporting is way easier and effective with these tables. In fact, it can save hours of manual reporting, thus making you a bit extra productive. Besides, pivot tables offers links to external sources for easy reference, thus saving you time and energy which otherwise get wasted in finding references.
How to create multiple pivot tables?
While Pivot tables hold special place in MS Excel’s functions list, they have a reputation of being complicated. But contrary to the belief, learning how to create pivot tables and combine multiple of them in one sheet is much easier than you may believe.
Usually, it’s best to set up your Excel fil with one pivot table per sheet, but you can create multiple of them without having to worry about overlapping. So, should we start the process?
1. Start with creating the first pivot table
Now that you’ve got the better sense of the pivot table, it’s good to move further into the nitty-gritty of how to actually create one.
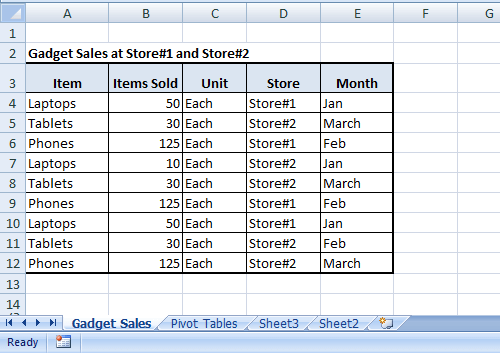
- Select any cell in the Source Data.
- Tap “Insert” and select Tables > Recommended PivotTables.
- Pick the PivotTable Layout from the recommended PivotTables screen and select Ok.
- Excel will now insert the first Pivot table in a worksheet.
- Once it’s inserted, click on any Cell within the table and this will open the PivotTable Fields list on the screen.
- Add and drag the Field items to modify the table according to your preferences.
2. Prepare for the second pivot table
As soon as you are done with creating the first Pivot table, it’s time to move onto the next one. However, before you jump into the same, make sure to carry out some preparation tips.
- Select about ten columns to the right of the first pivot table. As you drag across the column buttons, the tool tips shows how many columns have been selected.
- Reduce the column width of the selected one to about 2.00 aka 19 pixels. It is done to create a space between the two pivot tables, thus protecting them from overlapping.
- You won’t notice if the first pivot table expands a little but if columns are hidden to fill one of more of the spacer columns. In that case, it’s suggested to make them narrow, so you can identify problems instantly and avoid any glitches later on.
3. Make the second pivot table
Once you are done with aforementioned preparation tips, it’s time to create the next pivot table in the worksheet. The simplest method to make the new pivot table is to copy and paste the first pivot table, in order to save time and energy. Here’s how to do this.
- Initiate the process by selecting all the columns where the first pivot table is located.
- Press Ctrl+C to copy the selected column. Alternatively, you can select the column, right-click the mouse, and hover over the Copy option from the menu.
- After that, select the cell in the first row, in the column where you wish to paste the new pivot table.
- Press Ctrl+V to paste the entire column you’ve selected earlier.
- Repeat the process for other columns and complete your second pivot table. Once done, add or remove fields or modify the layout, as required.
Note: If you want to add more pivot tables in the same worksheet, then repeat the process above and make as many pivot tables as you want. However, be cautious when carrying out the process, and do whatever it takes to avoid data overlapping.
What to do to fix the Pivot Table Report Overlap Warning?
No matter how many precautions you take when adding two or more pivot tables in the worksheet, you’ll still come across the overlap warning signal when you try to make changes in them or refresh the page.
So, what should you do to resolve the problem? If this happens, users must simply click OK to close the warning message and space out the two pivot tables.
You can do it in two simple ways.
- Users can either add a few blank rows or some blank columns between two pivot tables and keep them far from each other.
Or
- You can also opt for adding slicers. However, this option can only be used if both tables are based on the same source data. You can connect them with each other using the same slicer. Here’s how to add filter slicers.
- Click on one of the charts and navigate to Analyze in the top menu ribbon.
- Select Insert Slicer and pick whichever metric you’d like to filter by.
- Tap Ok, and move to options in the top menu to interlink the fliter slicer to all pivot tables.
- Select Report Connections, and pick the tables you would like your filter to work on.
- Click Ok, you are now good to go.
Conclusion
That’s how you can create multiple pivot tables on a single worksheet. Do you understand the process or have further queries? Whatever the case, you can share your feedback or query with us in the comments below. Our experts will get back to you in seconds and resolve the dilemma as soon as possible.
A pivot table is one of the powerful MS Excel features. Hence, make the best out of it by creating multiple of tables without adding number of Excel sheets.