
When it comes to forex technical analysis, indicators are a must. You can incorporate forex indicators into your trading strategy to get the best outcomes. But before you start, you need to educate yourself about forex indicators.
In this post, we will cover basic details about forex tools and indicators that are crucial for your trading plan. Meanwhile, you should check out the stock exchange opening times so you can prepare yourself accordingly.
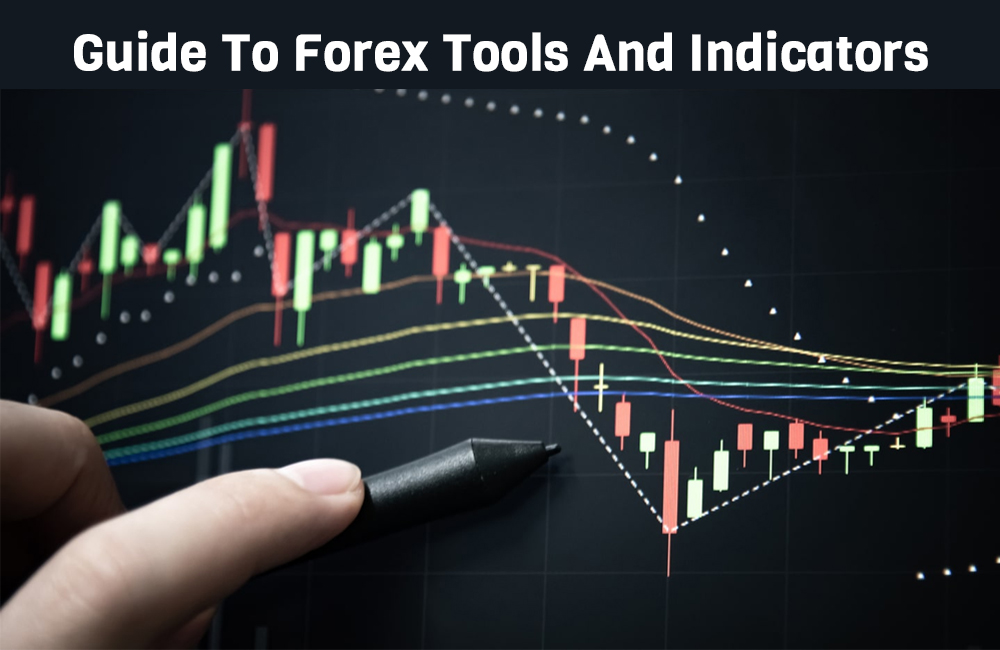
What exactly forex indicators are?
To put it in simple words, forex indicators are mathematical calculations that are used by traders to evaluate the exchange rate, open or volume interest of a currency pair.
While stock traders check the value of a stock, forex traders monitor the exchange rate of a currency pair. Most forex indicators are derived from exchange rates. Some common technical indicators used by forex traders are:
- Bollinger bands
- Zig zag
- Average price
- Moving average convergence/divergence
- Advance/decline
- Stochastic oscillator
- Moving averages
- Relative strength index
If you are just getting started with forex trading, you will need help with indicators. You can rely on forex brokers for guidance. They will provide detailed information about technical analysis tools and indicators.
How forex indicators are helpful?
Traders use indicators every day for technical market analysis. These indicators can help you make the right trading decisions. You can combine the information provided by indicators with your trading plan to get the best outcome.
Usually, traders take their indicators very seriously. They base their trading decisions on these indicators and therefore they are quite attached to them. To become a successful trader, you should learn more about forex indicators. The more knowledge you have, the better you will understand the use of indicators.
However, it should be noted that all forex indicators are not the same. Some indicators are needed for specific cases and others are used by derivatives traders. Some indicators are used regularly by traders.
A good indicator can be applied to many trades. It should also provide clear signals and detailed information about the market. You should choose an indicator that will help you to determine the exchange rates of currency pairs.
Top Forex Indicators
After discussing the basics of forex indicators, let’s take a look at the top ones that are used by most traders. We have provided a brief description of all the indicators, so it’s easier for you to understand.
- Moving averages
Starting the list with moving averages which are used by traders to get a better idea about the market trend or condition. There are four main types of moving averages simple moving averages, smoothed moving averages, weighted moving averages, and exponential moving averages.
The averaging process is often performed on the low, high, closing, or open exchange rates. However, the close is probably the most popular of all.
- Bollinger bands
Bollinger bands were first introduced in the 1980s by John Bollinger. It was created to offer trading signals that can easily adapt to market conditions. They are based on standard deviations around a primary moving average.
The parameters involved are 2 standard deviations around a 20-period simple moving average. Standard deviations are useful in measuring market volatility and therefore help traders determine the risk involved.
- Relative strength index
It was first created in 1978 by J. Welles Wilder, who was a well-known technical analyst of his time. It is currently one of the top forex indicators out there. It can be computed by comparing the increasing exchange rate with the dropping exchange rate of currency pairs.
The good thing about RSI is that it has a period parameter. Most traders settled for the 14-period parameter. When the RSI goes above 70, it indicates an overbought market. When the mark is below 30, it indicates an oversold market.
- Stochastic oscillator
It was created by George C. Lane in the 1950s to help traders identify extreme markets. The normalized range is between 0 and 100. Oversold is below 20 and overbought is above 80.
This indicator is also capable of informing traders about distribution and accumulation in the market. If the market closes near stochastic’s low values, it means there’s selling pressure. The buying pressure is high when the market closes near the indicator’s high value.
- MACD
MACD is short for moving average convergence divergence. It was introduced by Gerald Appel. It relies on the difference between 2 exponentially weighted moving averages.
While the slower is 1 of 26 periods, the faster is 1 of 12 periods. On the other hand, 9 periods indicate a smoothed moving average.
Final Words
Forex indicators and tools are needed for technical market analysis. It is used by traders to determine market risks and other important things. Incorporating indicators in your trading plan can lead you to greater results.